December 12, 2015
The Factors Related to Density of PM 2.5 in Ambient Air: A Study Based on Statistics
Zhuoqun Cao
- Introduction
PM 2.5 is defined as the fine particles in ambient air with the diameter equal to or less than 2.5 mm. It can suspend in the air for a long time and has significant influence on air quality and visibility. Higher density of PM 2.5, more serious air pollution will be. In addition, PM 2.5 is a great threat for human health. In October 2013, World Health Organization for the first time identified PM2.5 as carcinogen. Especially it can lead to lung cancer.
In September 2010, NASA published a map of global air quality, which especially showed the density of fine particulate matter around the world. According to the map, the area around Beijing, China, has the highest PM 2.5 concentration. This article concerns about the factors related to density of PM 2.5 in ambient air, based on the statistics of Beijing air quality reports.
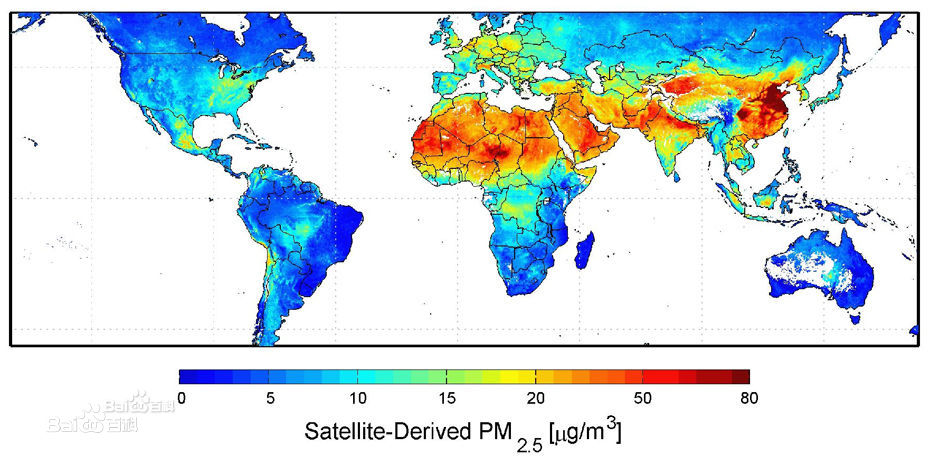
Figure 1 Map of Global Air Quality
- Methodology and Data
In the paper, I use EXCEL as my tool to analyze the PM 2.5 data in the time period from December 2013 to November 2015. The Beijing air quality data can be found at http://www.aqistudy.cn/historydata/. The history weather of Beijing can be found at http://lishi.tianqi.com/beijing/index.html and http://tianqi.2345.com/wea_history/54511.htm. I adopt the technology of hypothesis testing and correlation to study whether the factors including wind level, rain day, Spring Festival and government policy affect the density of PM 2.5.
The original weather data of wind only provide a range instead of specific level. To deal with this problem, I assign random number in the wind level range as specific wind strength. This is for two reasons. First of all, wind level approximately corresponds to linear relationship with wind strength. Secondly, wind level is an overall monitoring result of different stations in different time. In other word, there is no way to decide a certain wind level for entire city in a whole day, which means the weather report can not accurately reflect the real situation. Therefore, using random number in the level range could be an appropriate way to eliminate observation error. In addition, I only classify raining weather to 2 types: rain and no rain, because it is hard to digitalize the raining condition.
- Weather Factors
As we all know, air quality is mainly affected by wind and rain. In this part, to test whether wind and rain can reduce density PM 2.5, I calculate correlation coefficient between PM 2.5 and wind level. Besides that, I test the null hypothesis that PM 2.5 is higher in the raining day and PM 2.5 is higher in the after the raining.
- Wind
A Scatter Chart of PM 2.5 and Wind is showed in figure 2. The EXCEL result showed that correlation coefficient between PM 2.5 and wind level based on this model is 0.01724. With hundreds times of modifying random value of wind level, the correlation coefficient r is no more than 0.1.
Because the value of Person’s r is very close to 0, it can be inferred that there is no linear relationship between PM 2.5 and wind strength. Also, from the scatter chart, it is hard to justify other relationships.
Although, wind makes contribution to the diffusion of other pollutant, it cannot reduce the density of PM 2.5.

Figure 2 A Scatter Chart of PM 2.5 and wind
- Rain
To test whether the means of PM 2.5 value are different in raining day and no raining day, I need to test whether their variances are equal.
Null hypothesis: the variances are equal
Test statistic: ratio of variance = Var1/Var2= 4877.7415/2161.6011=2.2565
According to EXCEL, P –value =2.6092* < 0.05
Reject the null hypothesis. Their variances are not equal
Then test whether the means of PM 2.5 value are different using unequal variance
Null hypothesis: the mean of PM 2.5 in raining days is higher
Test statistic: t = 1.066
According to Excel, P –value = 0.144
If use 0.1 as significance level, cannot reject null hypothesis. The result cannot confidently show the mean of PM 2.5 in raining day is lower. But P –value is not high. The reason for this dilemma is that raining impact on PM 2.5 is showed in the next day. It is totally possible that the statistical result of air quality was published during or before the rain. In this circumstance, air quality data will ignore the influence of rain.
To exclude this situation, I test whether the means of PM 2.5 value are different in the day after raining and no raining day
Test whether their variances are equal
Test statistic: ratio of variance = Var1/Var2=4784.3258/2022.8269=2.365
According to EXCEL, P –value = 3.99* < 0.05
Reject the null hypothesis. Their variances are not equal
Then test whether the means of PM 2.5 value are different using unequal variance
Null hypothesis: the mean of PM 2.5 in the days after raining is higher
Test statistic: t = 5.4502
According to EXCEL, P –value = 9.6318* < 0.05
Reject the null hypothesis. The means of PM 2.5 value in the days after raining is lower than the days without raining.
To conclude, rain can reduce the density of PM 2.5, but the effect is more apparent in the following day.
- Human Factors
Many researches point out that human activities including industrial emissions, fuel combustion and auto vehicle exhaust. In China, Spring Festival is the most important day for all families gathering together to celebrate Chinese New Year. In that time, some factories stop working and a large number of people will leave Beijing and go back to hometown. The PM 2.5 concentration could change during that period. Besides that, in 2014, Beijing held the APEC global meeting. Also, in 2015, Beijing conducted military review to celebrate The National Day. During these periods, government implement a vehicle limit policy and stopped all the factories around Beijing. Due to the government policy, PM 2.5 could also changed in that time.
Therefore, in this part, I focus on these special days to test whether the density of PM 2.5 decreased.
- Spring Festival
In Spring Festival, a large number of people will leave Beijing and go back to hometown. Most citizens live in Beijing also prefer staying at home for celebration. Beijing would become empty which probably reduce the density of PM 2.5.
To verify my assumption, I select 17 days, from 2 days before Spring Festival to Lantern Festival, as sample because it will cover most time of “empty Beijing”. Then I choose 17 days later to make paired comparison. Because fireworks are forbidden except Spring Festival, it can be another uncertain factor related to PM 2.5. Only by choosing the days after Spring Festival can I reduce the influence of burned fireworks during festivals.
First, test the data in 2014. Spring Festival is 1/30/2014.
In paired observation, the null hypothesis is: the mean of differences is equal to 0.
Test statistic:
t = 3.6452
According to EXCEL, P –value = 0.00218 < 0.05
Reject the null hypothesis. The mean of difference is not equal to 0.
In 2014, the mean of PM 2.5 value after Spring Festival is higher than the mean of PM 2.5 during Spring Festival.
Secondly, test the data in 2015. Spring Festival is 2/19/2014.
In paired observation, the null hypothesis is: the mean of differences is equal to 0.
Test statistic:
t = 0.599
According to EXCEL, P –value = 0.2788 > 0.05
Cannot reject the null hypothesis. The mean of difference is equal to 0.
In 2015, the mean of PM 2.5 value after Spring Festival has no significant difference with PM 2.5 during Spring Festival.
One probable explanation for this contrast result is that paired observation is not a suitable model to test differences in means. The other reason could be changing of weather condition. In 2015, Spring Festival was late. The paired sample after festival is in March, in which month temperature increased apparently.
Figure 3 depict the variation of PM 2.5 during Spring Festival. Both graphics show 3 peak values around the dates of Spring Festival, end of vacation and Lantern Festival. The peak values indicate large amount of burned fireworks, which is correspond to human habited behavior.
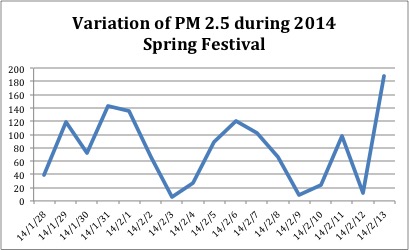
Figure 3 a Variation of PM 2.5 during Spring Festival in 2014
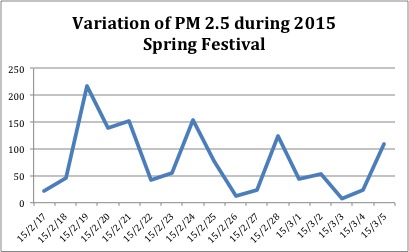
Figure 3 b Variation of PM 2.5 during Spring Festival in 2015
According to the analysis above, the density of PM 2.5 could drop down during Spring Festival. However, because of the large amount of fireworks, the effect is not apparent.
- Government Policy
In 2014, Beijing held the APEC global meeting. From 3 November to 12 November, Beijing implemented vehicle limit policy and stopped factories around capital city. Also, from 20 August to 4 September 2015, same thing happened due to military review. I select PM 2.5 values from those days and test whether it against the mean of whole data.
Null hypothesis: the mean of PM 2.5 values during APEC meeting is larger than whole data mean.
Test statistic: because population standard deviation is the STD of whole data, I use normal distribution.
Test statistic:
Z = 1.5039
According to EXCEL, P –value = 0.0663 < 0.1
Almost can reject null hypothesis, the mean of PM 2.5 values during APEC meeting is lower than whole data mean.
Null hypothesis: the mean of PM 2.5 values during military review is larger than whole data mean.
Test statistic: because population standard deviation is the STD of whole data, I use normal distribution.
Test statistic:
Z = 3.6161
According to EXCEL, P –value = 0.0001495 < 0.05
Reject null hypothesis, the mean of PM 2.5 values during military review is obviously lower than whole data mean.
To conclude, car limit policy can reduce vehicle exhaust. Stopping industrial factories lower the combustion of fuels. These factors make contribution to decrease of PM 2.5 density.
- Summary
In the article, I test four factors including wind, rain, vehicle exhaust and fuels combustion related to the density of PM 2.5. Statistical results showed that wind cannot diffuse PM 2.5 concentration, but rain can. Reduction of vehicle exhausts and fuels combustion can originally cut off the source of PM 2.5. Although in different principles and methods, these factors can both efficiently reduce the density of PM 2.5 in ambient air.